Home IoT Management System - MPTRhome
A modular home IoT management system designed to unify heterogeneous smart devices into a single, controllable platform.
Problem
Most home automation ecosystems are fragmented: different protocols, closed ecosystems, cloud dependency, and limited customization. Integrating Zigbee, Wi-Fi, and custom IoT devices into a single system often requires multiple tools and complex configuration, which is inefficient and hard to maintain.
Goal
The goal was to design a centralized IoT management system that can discover, register, monitor, and control diverse devices through a unified interface, while remaining scalable, protocol-agnostic, and suitable for custom hardware integrations.
Approach
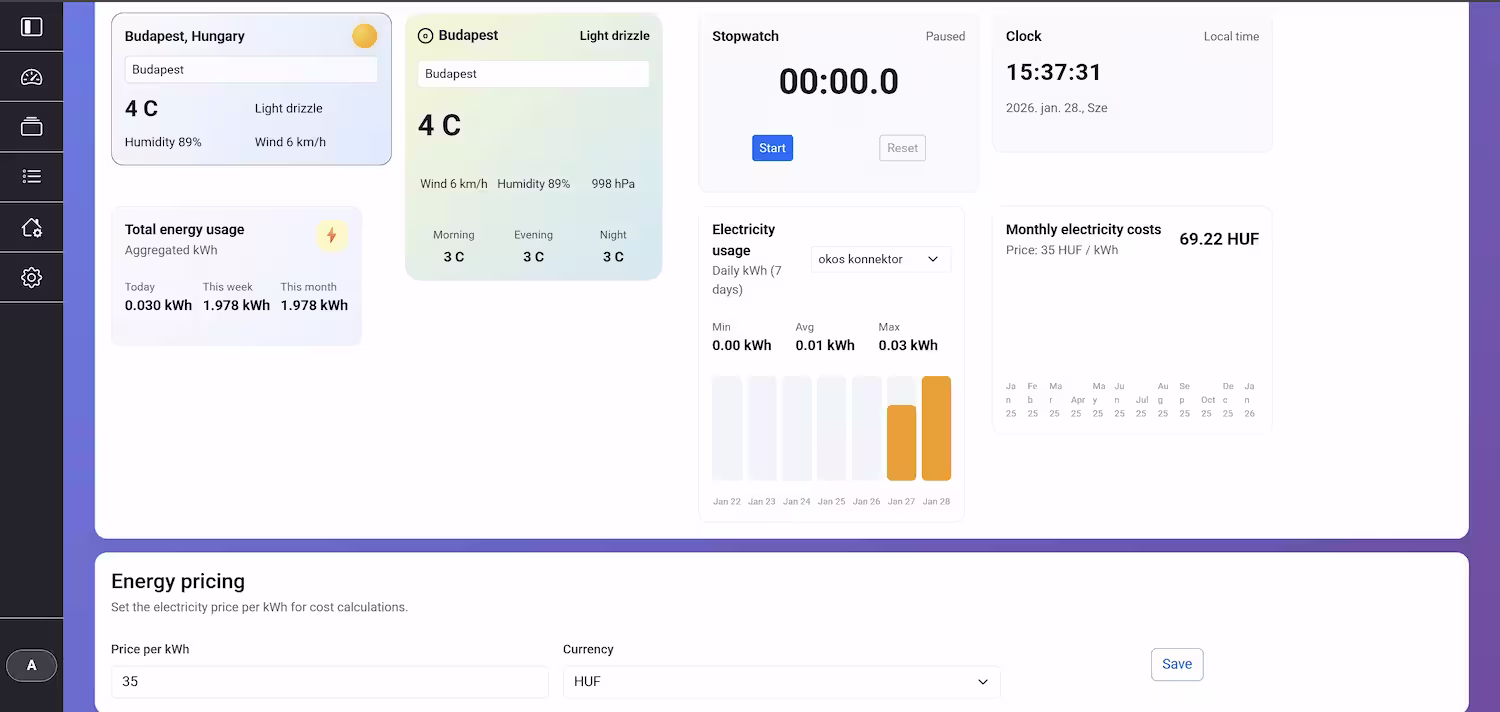
Dashboard
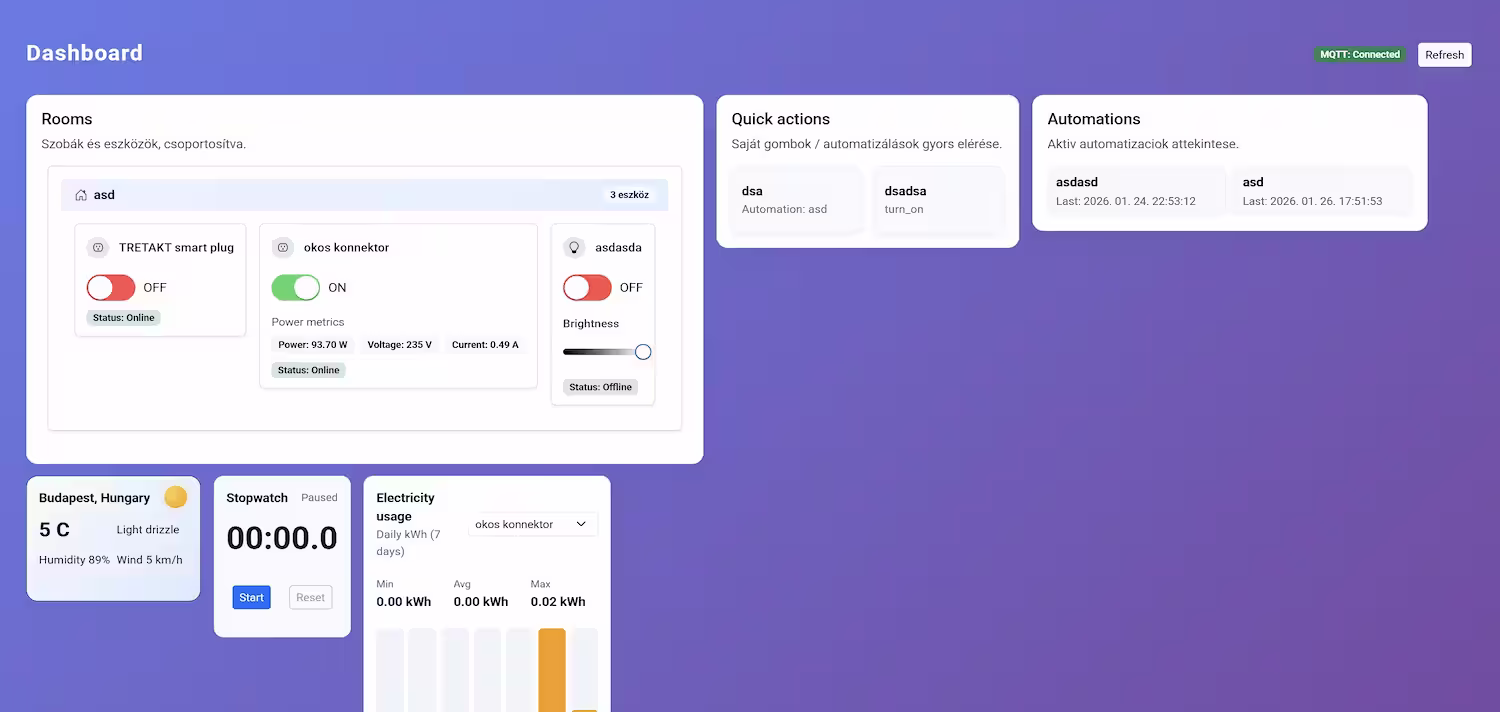
The main dashboard provides a quick overview of the entire smart home network. It summarizes key device statuses, active scenes, and recent events, offering a centralized starting point for monitoring and control. Users can quickly assess the state of their home and navigate to specific areas for more detailed interaction. Users can see their Rooms and device cards referenced in those rooms. Custom made quick actions can be placed on the dashboard for easy access to frequently used automations or device controls. Additional helper widgets can be added as well.
Devices Page
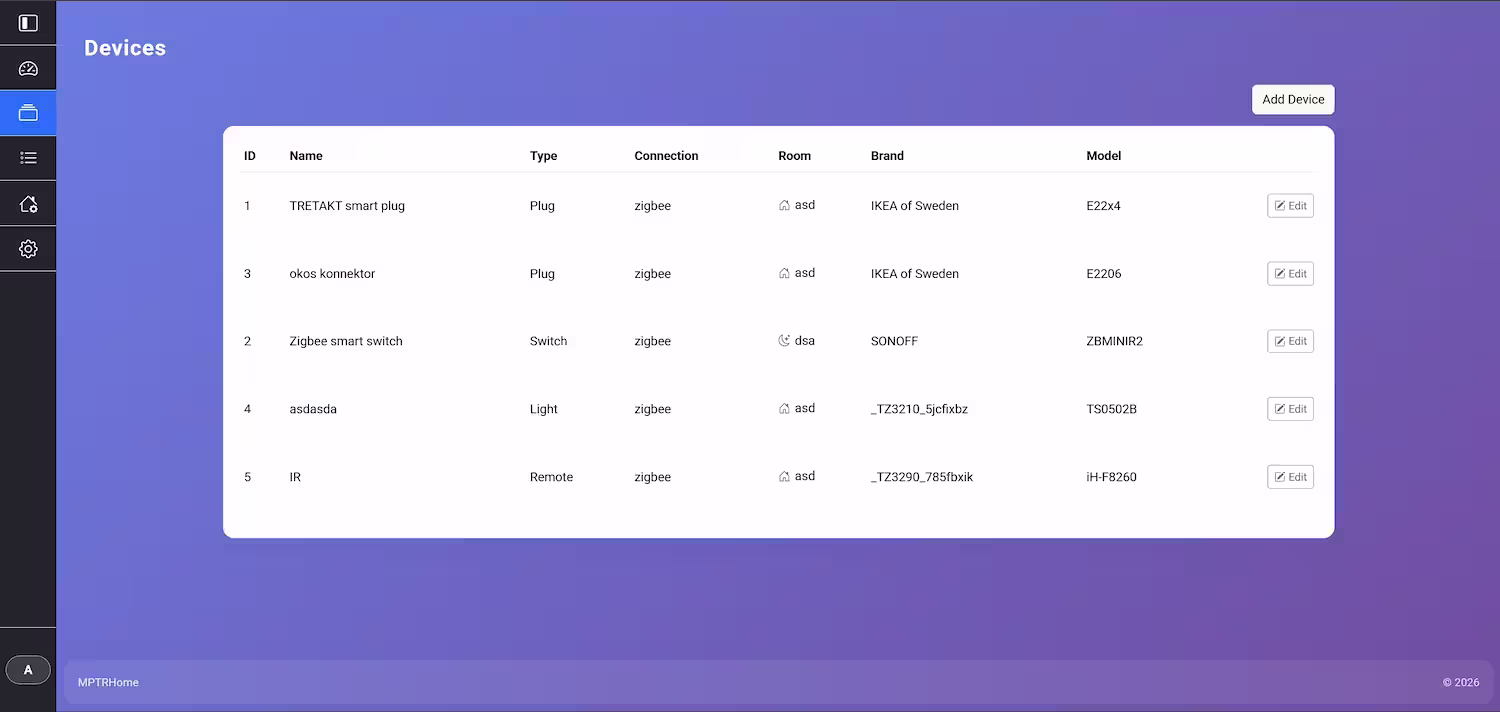
The devices page lists all connected hardware, regardless of its underlying protocol. From here, users can add new devices via a guided discovery process.
Device List
This view shows all connected devices, their status, and the rooms they are assigned to. It serves as the central hub for managing all hardware in the system.
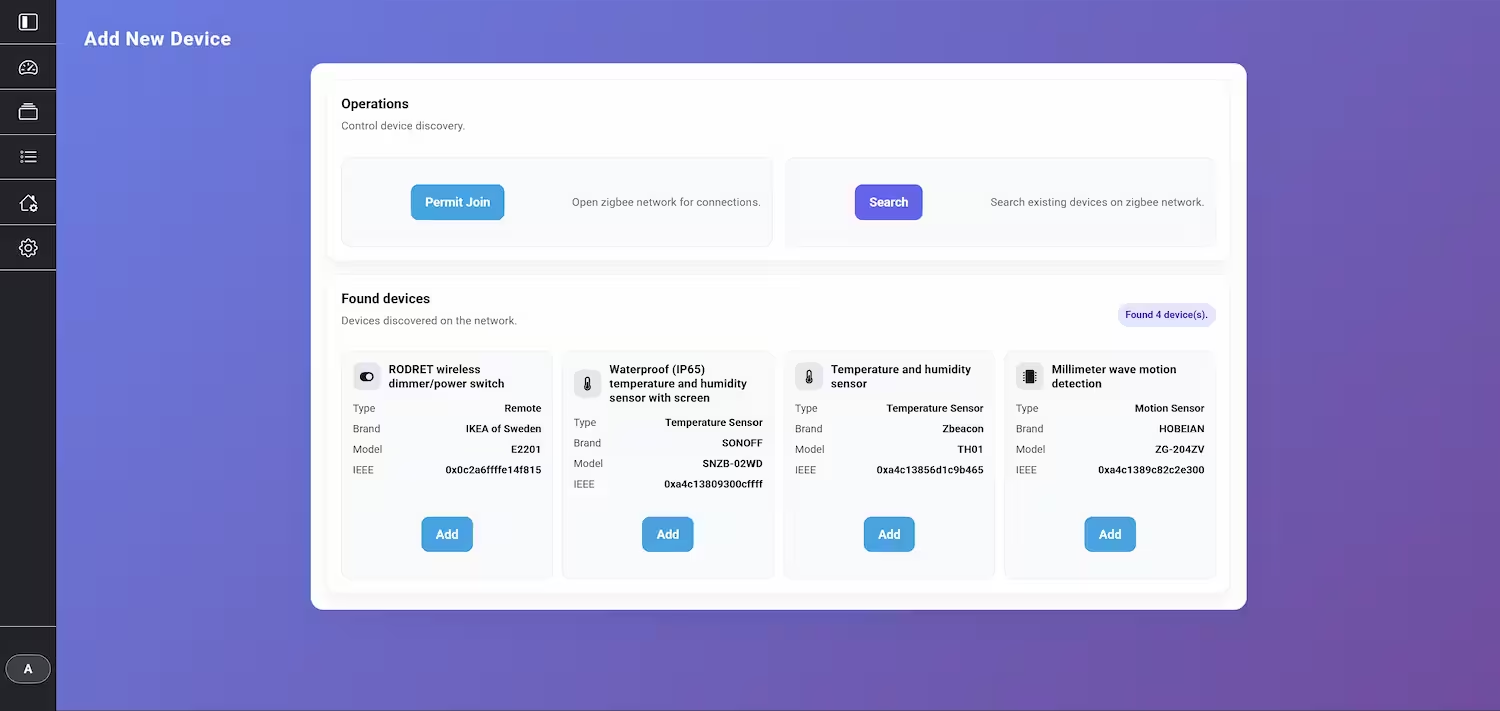
Adding a New Device
Users can add new devices to the system database via this page. Permit join button allows new devices to be discovered and added via the Zigbee engine behind the scenes, Zigbee2MQTT. The search button initiates the scanning of the devices connected to the network. The user can then select the device they want to add from the list of discovered devices.
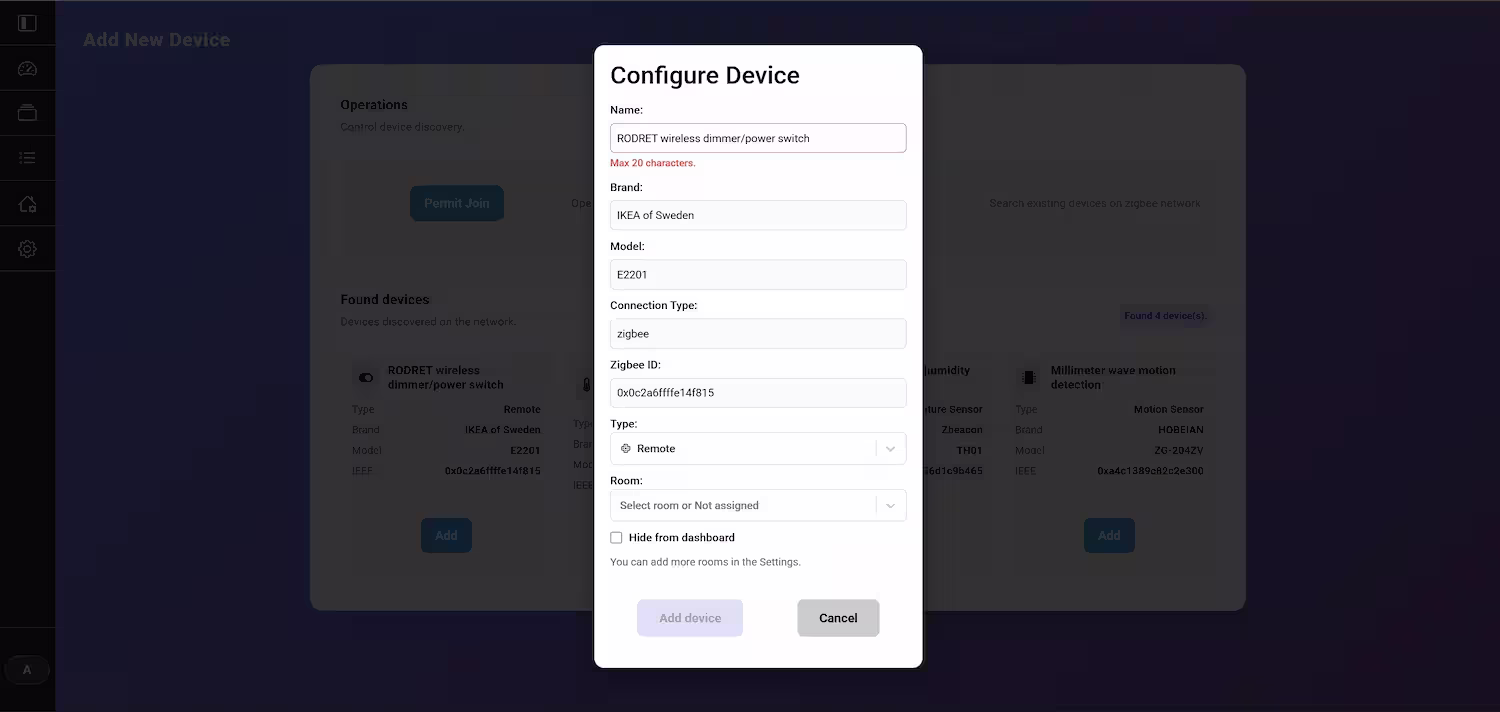
Post-adding Configuration
After a device is added, it appears in the configuration panel, where it can be assigned a name and a room before being finalized into the system. If the system failed at identifying the device type (e.g. Temperature Sensor), the user can correct it here.
Device Page
Each device has its own dedicated page that exposes all its controllable entities, such as switches, sensors, or lights. Users can interact with the device in real-time from this interface. In the top row, users can see the most important data of the specific device, chosen by the user in the device settings page.
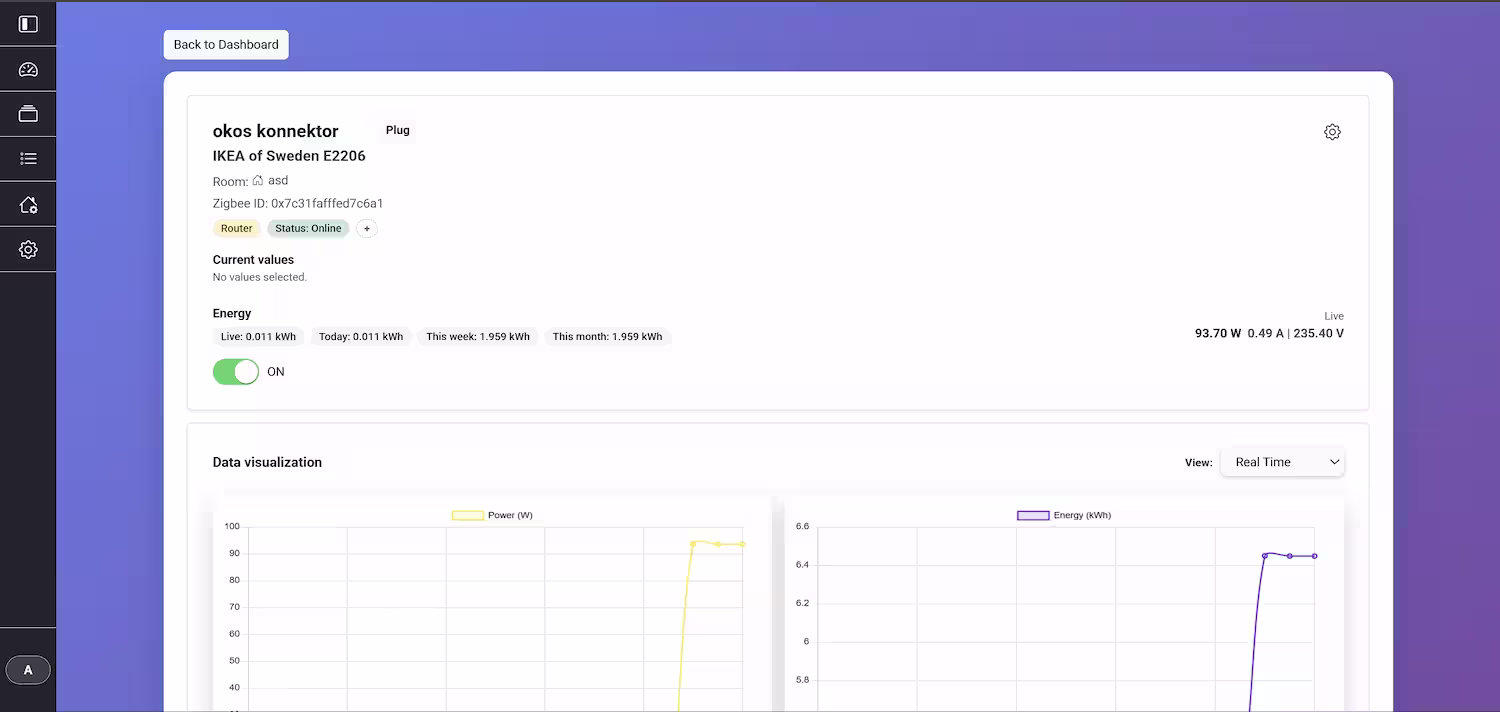
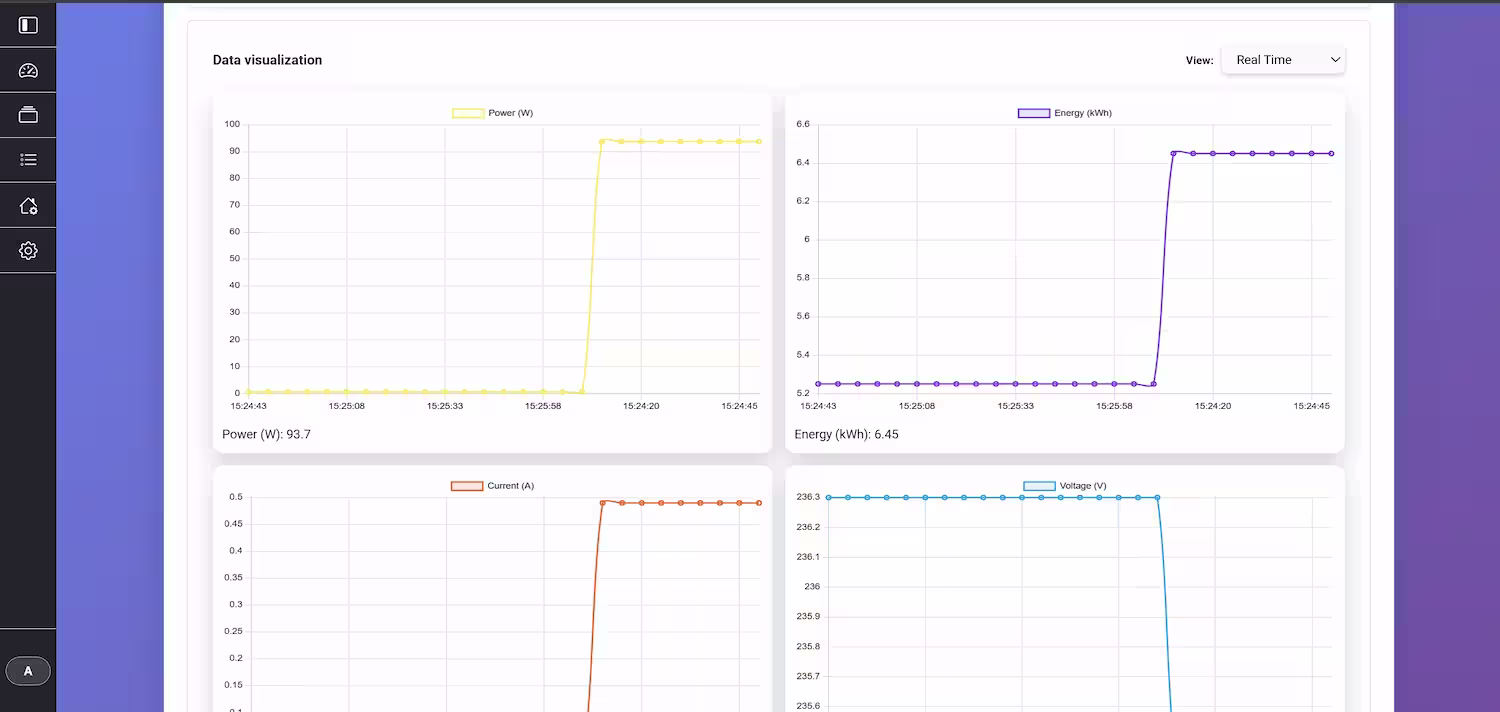
Data Visualization
For devices that produce time-series data (like temperature or energy sensors), the system automatically generates historical graphs. This allows users to track trends and monitor device performance over time. There are multiple chart views, like real time, last hour, year, and custom ranges.
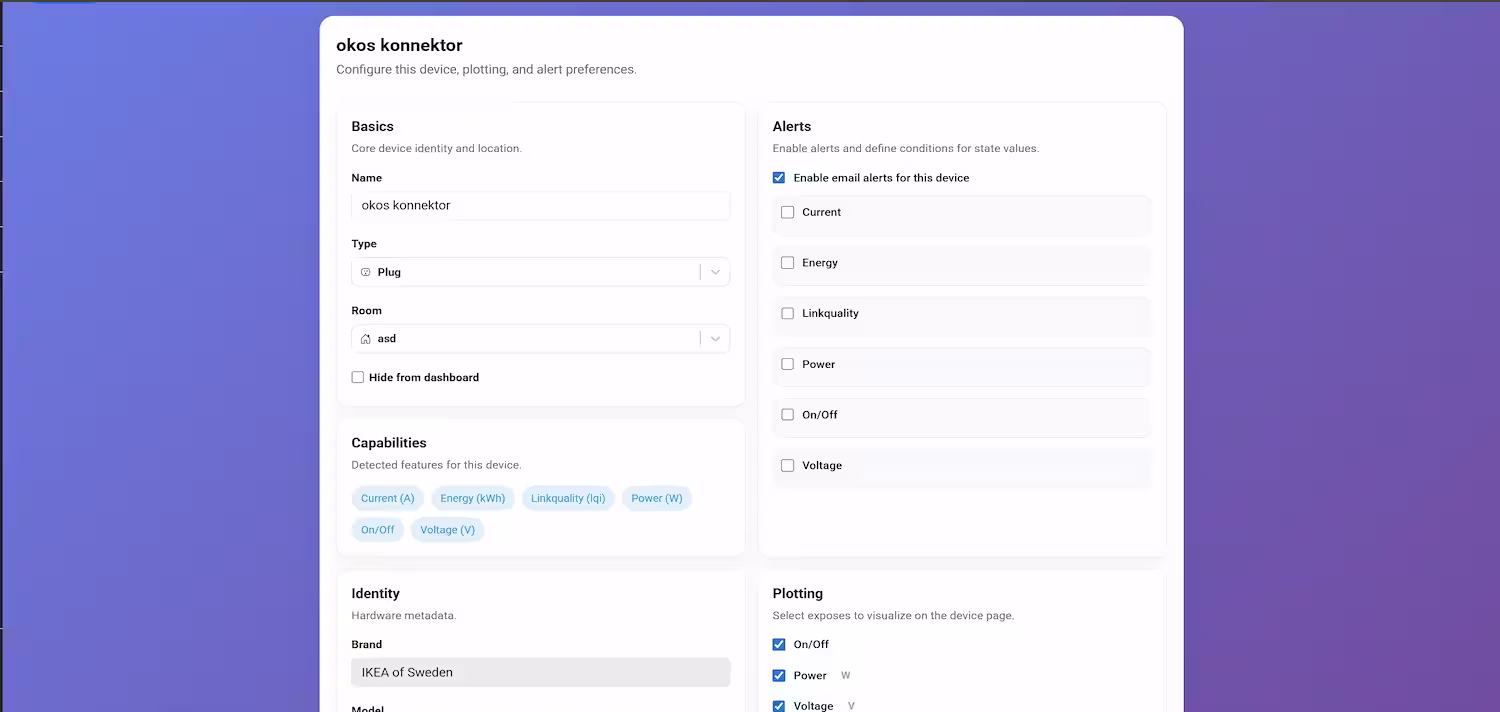
Device Settings
Each device has a dedicated settings panel where users can fine-tune its behavior. This includes changing the device name, assigning it to a different area, or viewing detailed entity information. The system also provides a straightforward process for choosing the desired data to plot, or to send alerts about. Alerts can be sent to an email address, and the logical criteria for triggering these alerts can be customized.
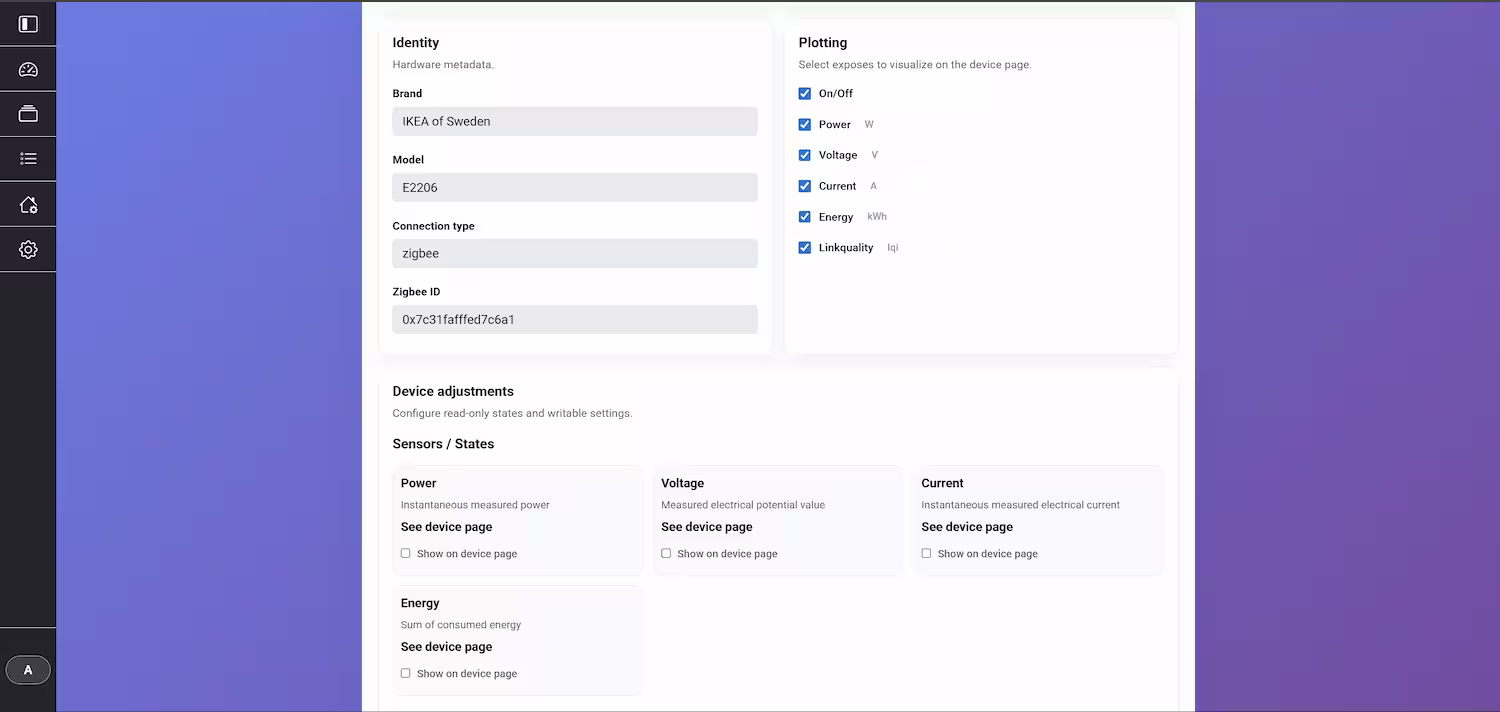
Advanced Settings
Users can access more advanced configuration options, such as customizing the device behaviour, based on the entities exposed by the device.
Related Entities
This view shows all the individual sensors and controls (entities) that make up a single hardware device, giving a detailed look into its functions.
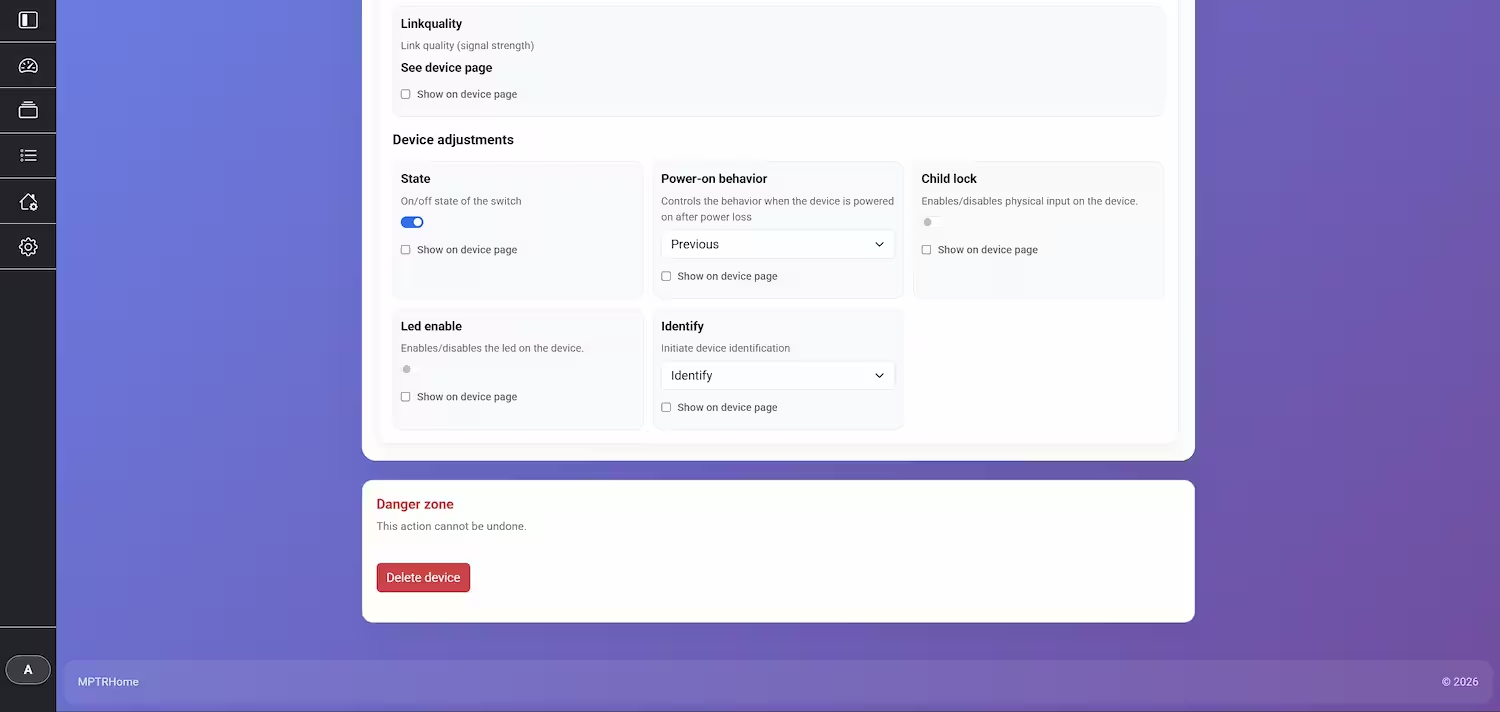
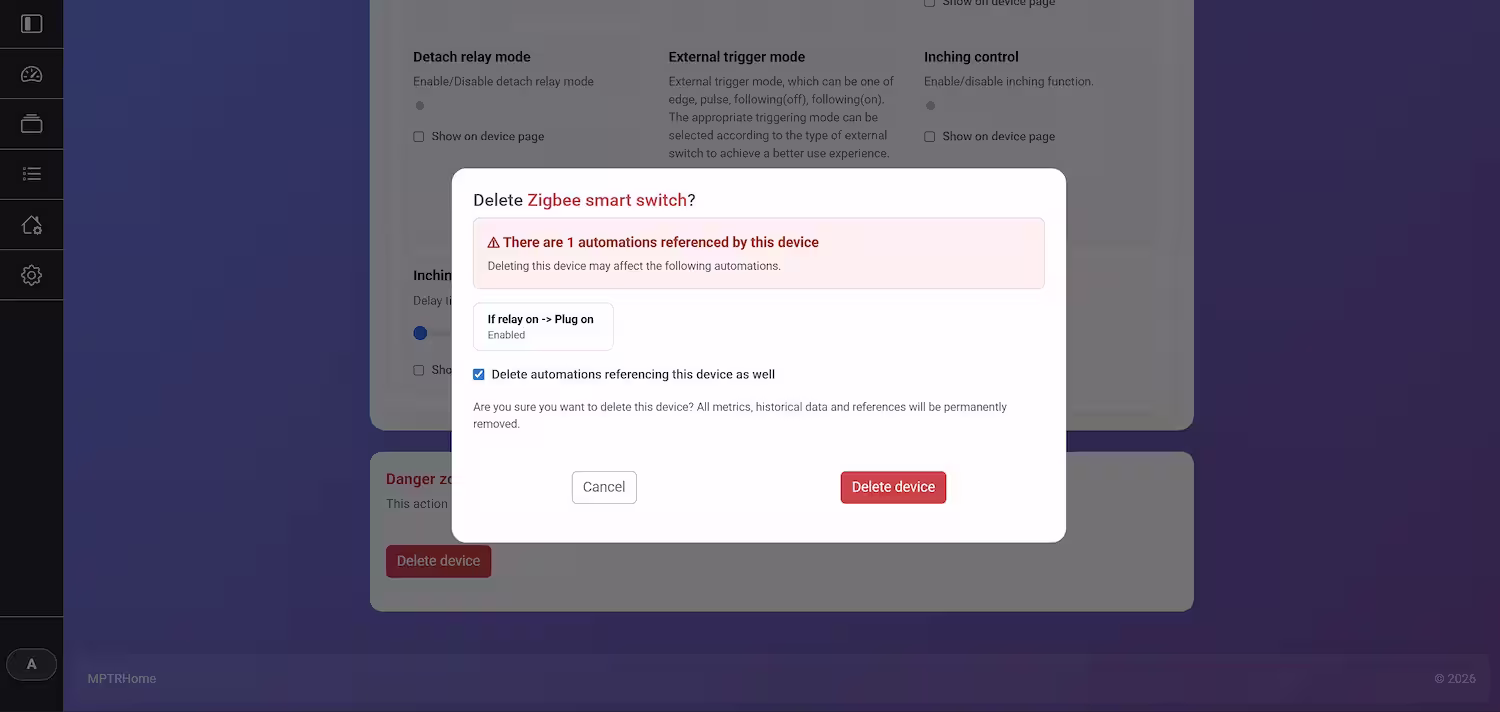
Deleting a Device
A confirmation step ensures that devices are not accidentally removed from the system. The system warns the user if there are automations referenced by the device before allowing deletion. The user can then decide whether to delete the automations as well, or keep them and edit them later.
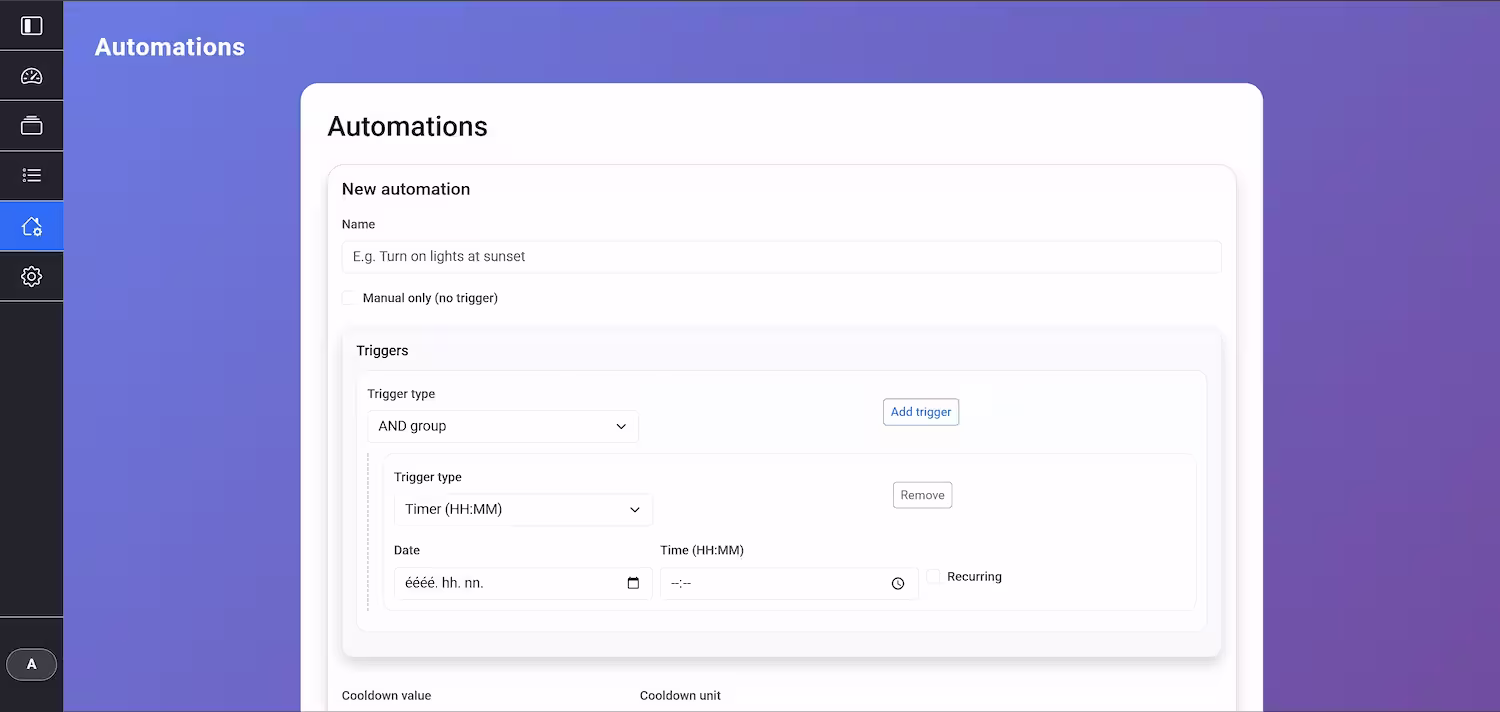
Automations
The automations engine allows users to create powerful, event-driven workflows. Rules can be defined based on device triggers (e.g., a sensor detecting motion), time schedules, or system events. The interface supports creating, editing, and duplicating automations, with shortcuts for quick access to frequently used rules.
Trigger definition
The user can create automations with numerous settings to define triggers, conditions, and actions. User can implement complex logic with OR and AND conditions to tailor the automation behavior precisely. Trigger can be a recurring date/hour, or a device event.
Action definition
The user can set the action triggered by the trigger. Multiple ones can be implemented independently.
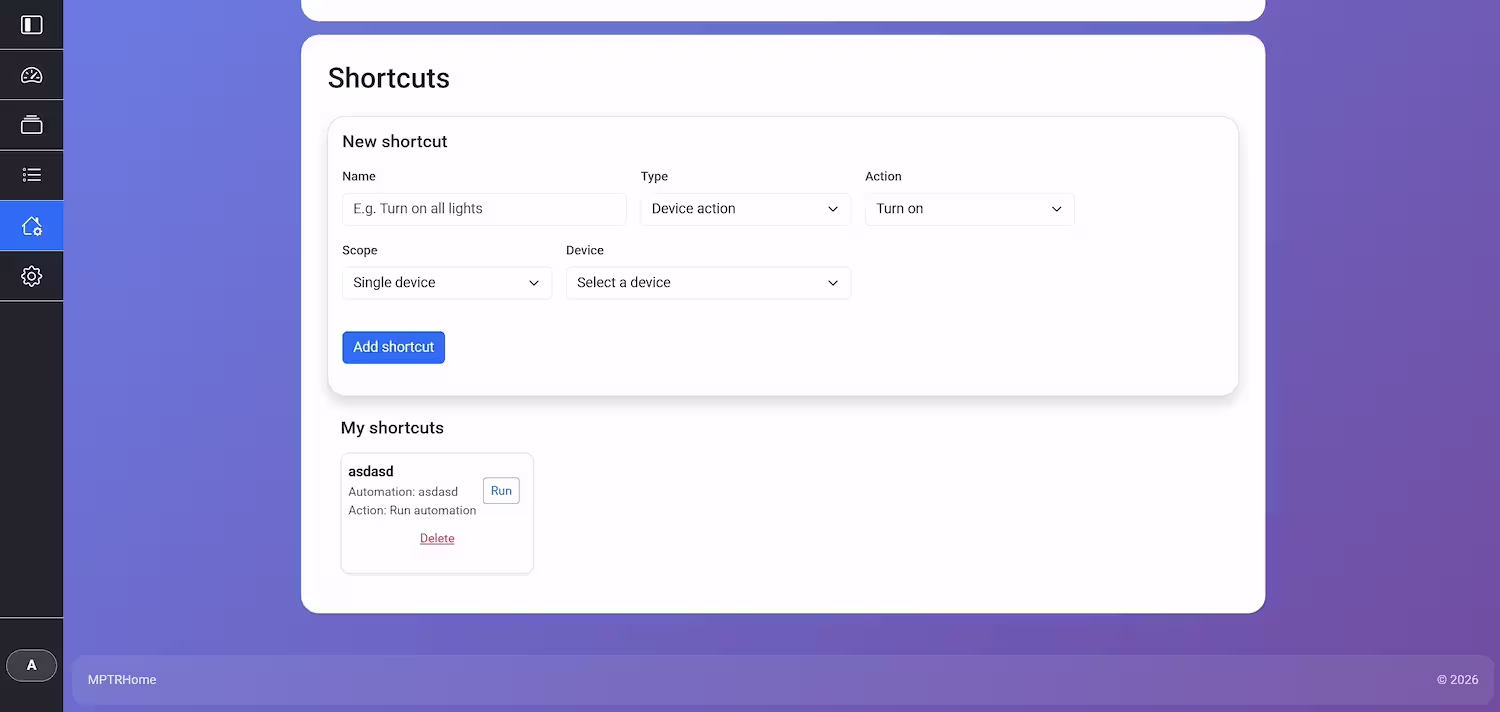
Manual automations
Users can set up automations that require manual activation, providing flexibility for user-initiated actions. Manual automations can be tied to a quick action button, which makes it easy to fire the automation with a single click.
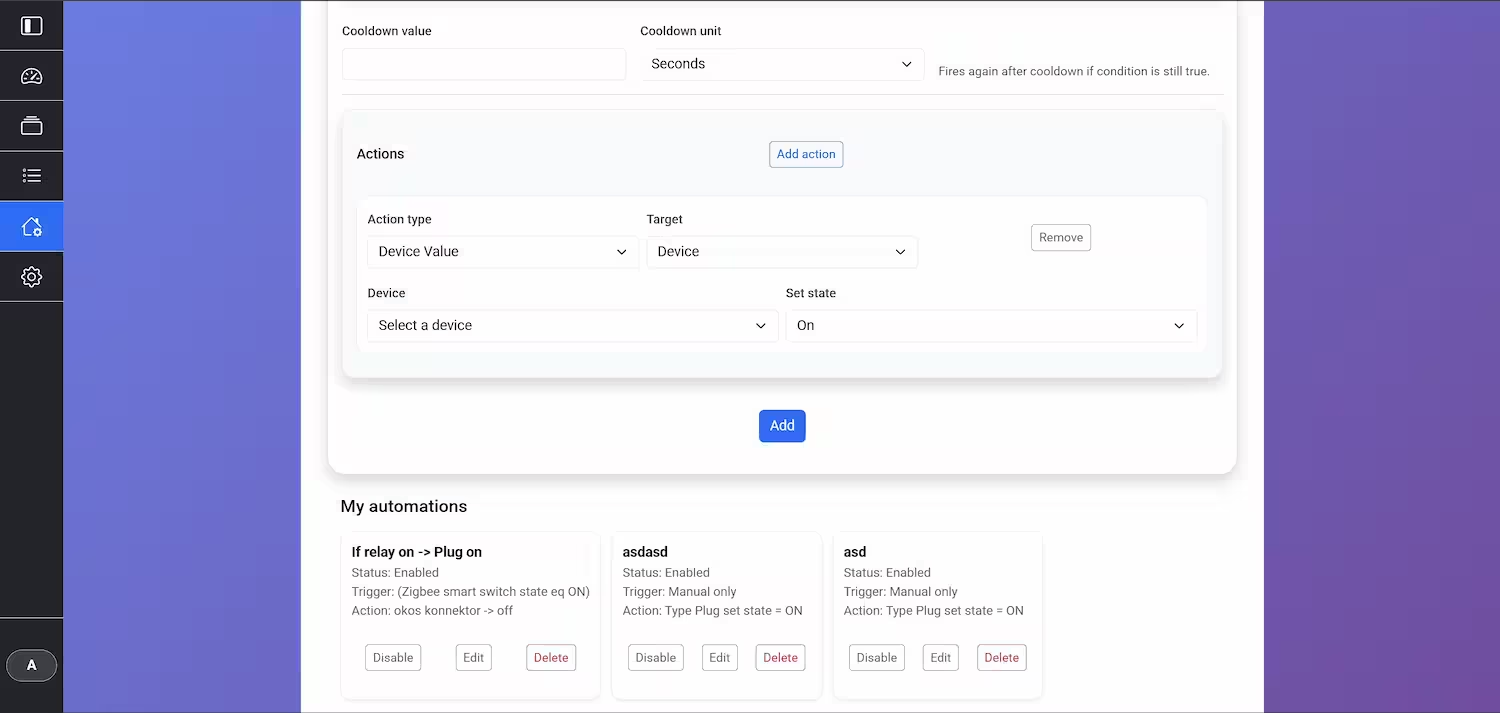
My Automations
Users can see, edit, disable/enable, and delete the currently active automations.
System Settings
The settings section provides comprehensive control over the MPTRhome instance. Users can manage system-level configurations, add or remove integrations, manage user accounts, and view system health information. This centralized hub ensures that all administrative tasks are easily accessible.
Room settings, Metric storage, and Tags
The central navigation for all system-level configurations. Users can add or remove Rooms. Metric logging settings are also accessible here. Tags can be created, to make custom device groups.
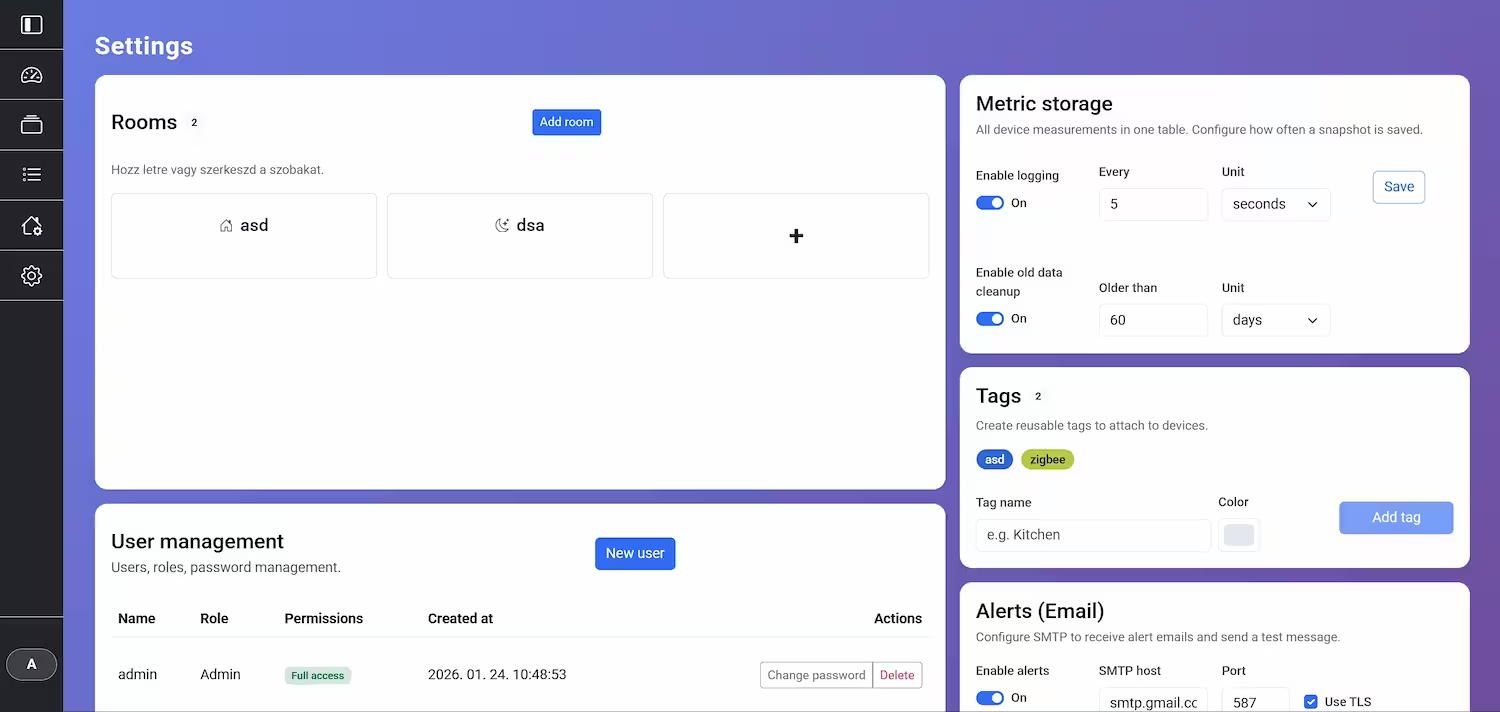
User Management, Alert settings
Here users can be added, removed or edited. Permissions can also be set based on your needs. Alert settings allow customization of notification preferences, for example smtp server to use, app password, email to send from and to send to.
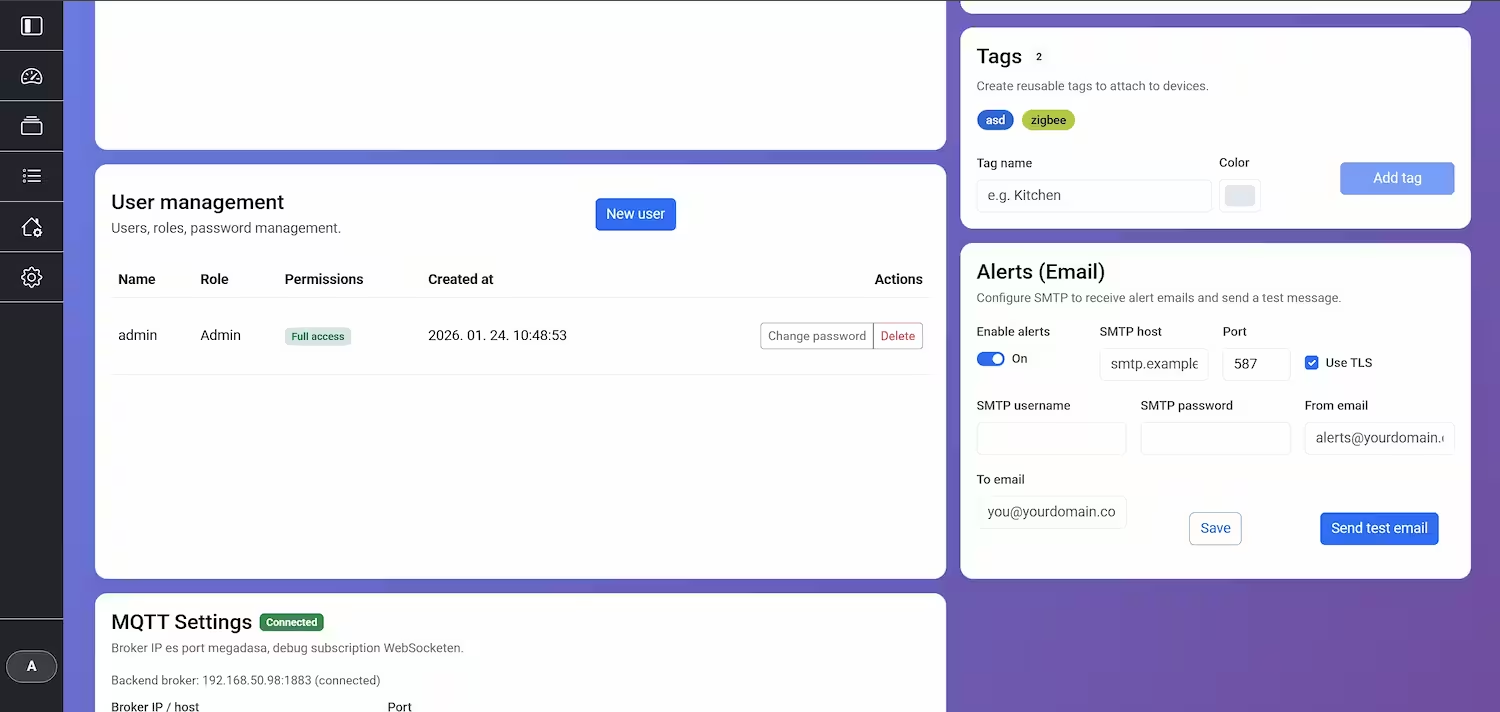
MQTT Settings
MQTT Server connection can be set up here. A debug panel is implemented as well, to monitor and troubleshoot MQTT messages in real-time.
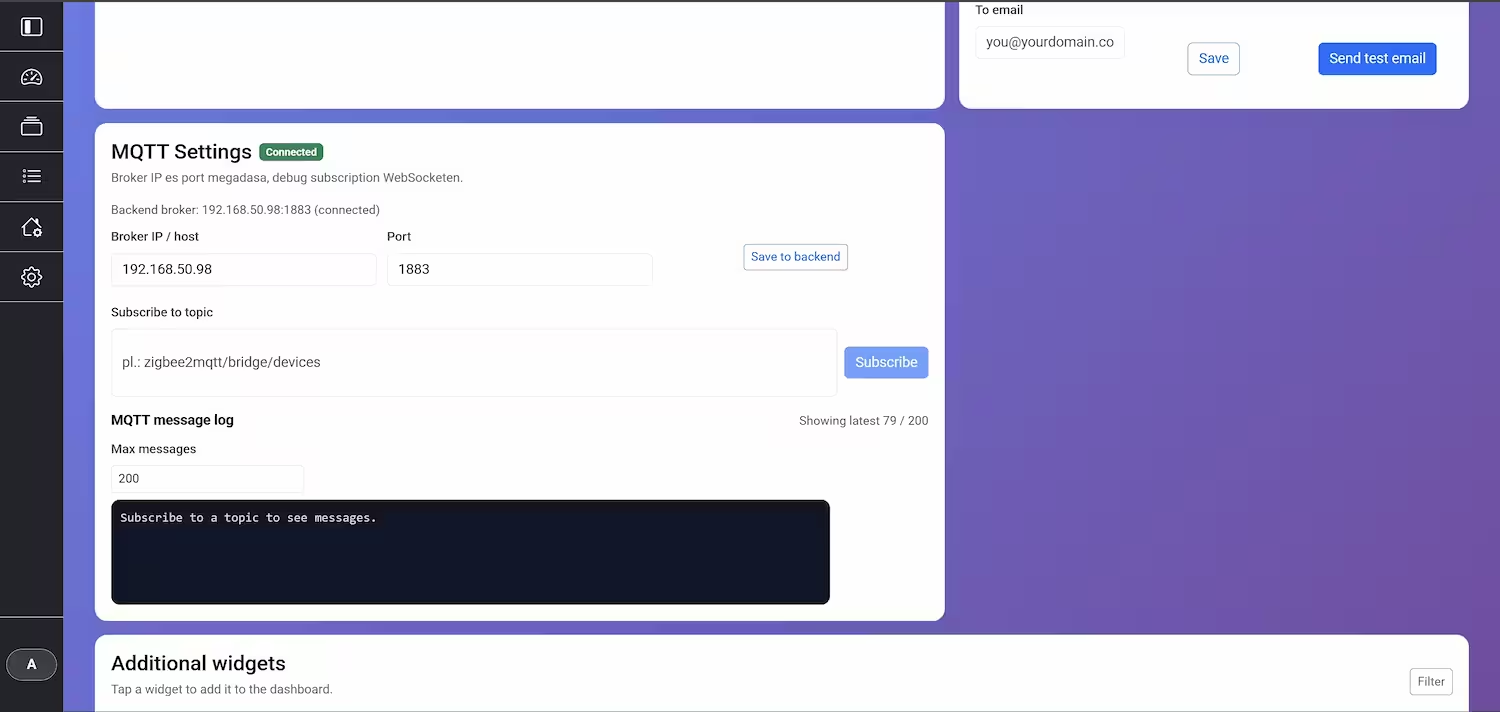
Custom widgets
Users can add to additional widgets to dashboard from here. Numerous widgets are available, including charts, gauges, weather, energy-related and control elements. New widgets are introduced regularly to enhance functionality and user experience.
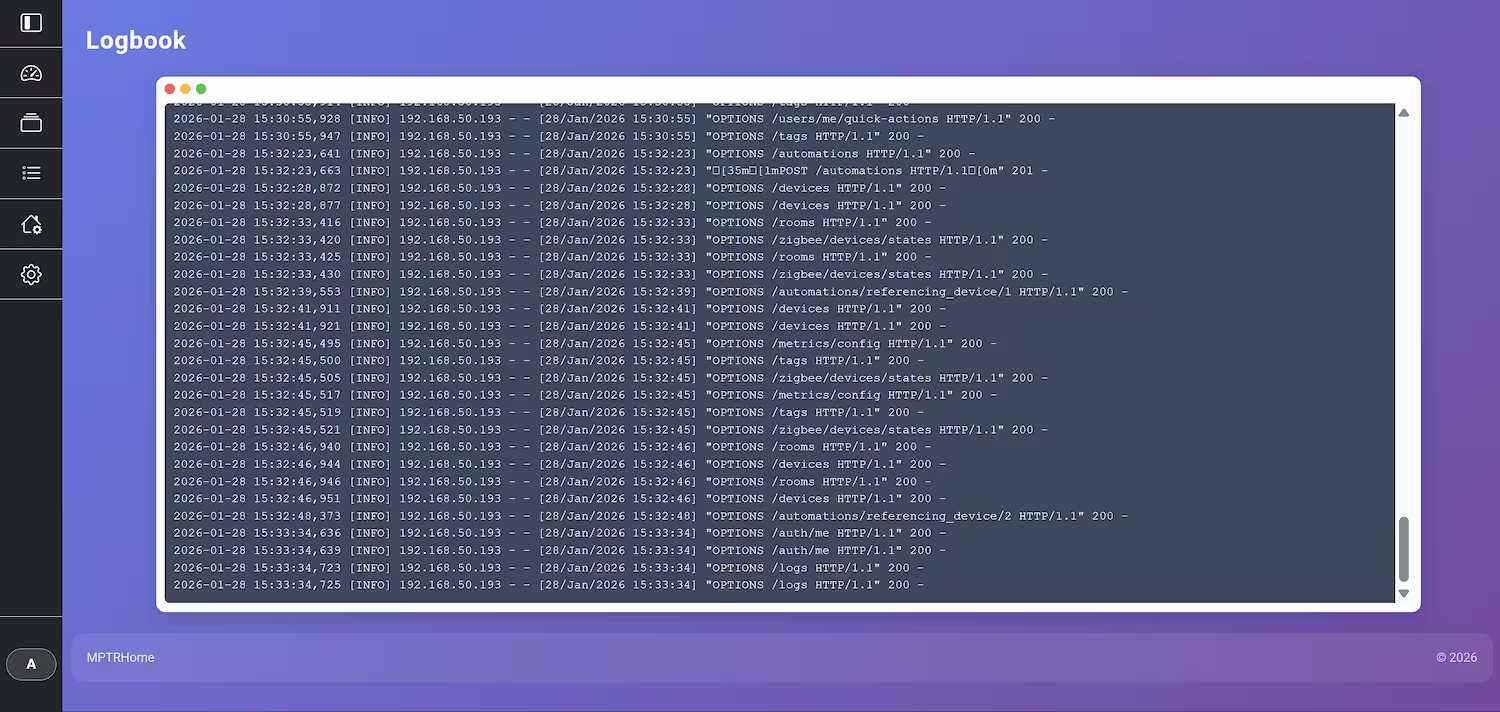
Logbook
The logbook provides a detailed, time-stamped record of every event that occurs within the system. This is invaluable for debugging, understanding device behavior, and auditing system activity. Users can filter the logbook to quickly find specific events or analyze patterns over time.
Current state
The system is updated regularly, and new features are added based on user feedback and technological advancements. The first deployment is already live and operational, providing valuable insights and functionality to users.